Introduction to Candlestick Patterns
Candlestick patterns are among the most trusted visual tools for analyzing price movement in financial markets. Whether you’re trading stocks, forex, or cryptocurrencies, these patterns can give you an edge by forecasting potential price movements. But what exactly are candlestick patterns, and why are they so effective?
What is a candlestick pattern?
A candlestick pattern is a specific formation of one or more candlesticks on a price chart that traders interpret to forecast future price action. These patterns are derived from the open, high, low, and close prices of a particular time frame.
History and origin of candlestick charting
Candlestick charting originated in Japan in the 18th century, developed by Munehisa Homma, a legendary rice trader. He realized that price movements were influenced not just by supply and demand but also by traders’ emotions. This led to the creation of visual representations—candlesticks—to gauge market sentiment.
Why traders rely on candlestick charts
Candlestick charts provide a quick snapshot of market psychology. They’re easy to interpret, visually intuitive, and can signal trends, reversals, and potential breakout points faster than traditional line or bar charts. Because of this, they’ve become a staple for both novice and professional traders.
Anatomy of a Candlestick
To read candlestick patterns effectively, you need to understand how each candle is constructed.
Components – Body, Wick, Shadow
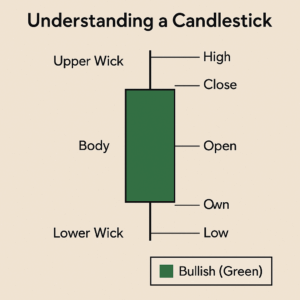
Each candlestick consists of:
- The body: Shows the range between the opening and closing prices.
- The wick or shadow: Represents the highest and lowest prices during the period.
- The color: A green (or white) body typically signals a bullish move, while a red (or black) body represents a bearish move.
Bullish vs. Bearish candles
A bullish candle means the price closed higher than it opened, indicating buying pressure. A bearish candle, conversely, signals selling pressure as the price closes lower than it opened.
Timeframes and their impact
Patterns vary significantly across timeframes. A bullish engulfing on a 5-minute chart may not carry the same weight as one on a daily chart. Always align your pattern analysis with your trading timeframe.
Categories of Candlestick Patterns
Candlestick patterns are broadly classified into:
Single candlestick patterns
- Involve one candle and often indicate potential reversal points.
Double candlestick patterns
- Combine two candles and provide stronger signals due to the interaction between the two.
Triple candlestick patterns
- These are more complex and often signal stronger trend changes.
Popular Bullish Candlestick Patterns
Understanding these helps traders spot potential buying opportunities.
Hammer
A candle with a small body and a long lower wick. It suggests a potential bullish reversal after a downtrend.
Morning Star
A three-candle pattern that starts with a long bearish candle, followed by a small-bodied candle, and ends with a bullish candle. It signals a shift from selling to buying pressure.
Bullish Engulfing
Occurs when a small red candle is followed by a large green candle that completely engulfs it. This signals strong buying interest.
Inverted Hammer
Appears at the bottom of a downtrend. The long upper wick suggests buyers attempted a reversal.
Popular Bearish Candlestick Patterns
These indicate potential sell signals and trend reversals.
Shooting Star
Looks like an inverted hammer but appears at the top of an uptrend. It shows buyers failed to sustain higher prices.
Evening Star
The bearish counterpart of the Morning Star. It typically signals the end of an uptrend.
Bearish Engulfing
A strong red candle engulfs the previous green candle, showing a shift in momentum from buyers to sellers.
Hanging Man
Occurs after an uptrend and suggests the rally may be losing strength.
Reversal vs Continuation Patterns
Understanding whether a candlestick pattern signals a reversal or a continuation is key to making accurate trading decisions.
Identifying trend reversals
Reversal patterns appear at the end of a prevailing trend and hint at a potential change in direction. For example:
- Morning Star and Bullish Engulfing suggest a downtrend might reverse.
- Evening Star and Bearish Engulfing indicate the uptrend may be fading.
Context matters. Always confirm the reversal with volume spikes or other indicators.
Recognizing continuation signals
Continuation patterns suggest that the current trend is likely to persist. Patterns such as Rising Three Methods or Falling Three Methods fall into this category. These are typically seen as a pause or consolidation within a trend before it resumes.
Combining with trend lines
To improve accuracy, overlay candlestick analysis with trend lines. If a bullish pattern forms near an upward trend line or a support zone, it strengthens the signal’s reliability.
How to Read and Interpret Patterns Effectively
Just spotting a pattern isn’t enough. Interpretation and context are everything.
Step-by-step analysis
- Identify the trend: Is the market trending or ranging?
- Spot the pattern: Recognize the candle shapes and their sequence.
- Confirm with context: Use volume, trend lines, or indicators to confirm.
- Plan your trade: Define entry, stop-loss, and target.
Using volume for confirmation
Volume is a key element. A candlestick pattern accompanied by a spike in volume is more trustworthy. It reflects stronger trader commitment behind the move.
Common interpretation mistakes
- Over-relying on patterns without broader context
- Ignoring higher timeframe trends
- Trading every pattern without confirmation
Candlestick Patterns for Day Trading
For intraday traders, fast and reliable setups are critical.
Best patterns for intraday trading
- Doji: Signifies indecision and potential reversals
- Bullish/Bearish Engulfing: For trend reversals during high volatility
- Harami: Indicates exhaustion of the current trend
Entry and exit strategies
- Enter on pattern confirmation (e.g., break of previous candle’s high/low)
- Use tight stop-losses due to shorter timeframes
- Aim for quick profits with favorable risk-to-reward ratios
Stop-loss placement
- Below the wick for bullish setups
- Above the wick for bearish setups
- Avoid setting stops too close to avoid getting “wicked out”
Candlestick Patterns for Swing and Position Traders
Swing traders hold positions for days or weeks, making higher timeframe patterns more relevant.
Ideal patterns for longer timeframes
- Morning/Evening Star on daily or weekly charts
- Piercing Line and Dark Cloud Cover
- Three White Soldiers and Three Black Crows
Support and resistance confirmation
Patterns near key levels like previous highs/lows or Fibonacci zones tend to be more reliable. Combining with support/resistance increases your odds of a successful trade.
Combining Candlestick Patterns with Technical Indicators
Adding indicators can validate candlestick signals and improve success rates.
Moving Averages
- Confirm trends (e.g., pattern above 50 EMA = bullish bias)
- Act as dynamic support/resistance
RSI & MACD
- RSI shows overbought/oversold levels that enhance pattern signals
- MACD crossovers with a reversal pattern give strong entry points
Fibonacci Retracement
Patterns forming near Fibonacci levels (38.2%, 61.8%) are often more powerful due to psychological significance.
Candlestick Pattern Reliability and Accuracy
No pattern is 100% foolproof, but knowing which are statistically more reliable helps.
Win rates of popular patterns
- Bullish Engulfing: ~60-70% when confirmed by trend
- Evening Star: ~65% effectiveness on daily chart
- Hammer/Inverted Hammer: ~55-60% depending on market
These statistics improve significantly when combined with confluence zones.
Factors influencing reliability
- Volume confirmation
- Market volatility
- Pattern timeframe
- Economic events or news catalysts
Common Mistakes to Avoid
Avoiding classic pitfalls is just as important as learning the patterns.
Overtrading signals
Don’t enter a trade based on every pattern. Wait for confirmation and context.
Ignoring trend context
Trading a reversal pattern in a strong trend is risky. Understand trend strength before entering.
Not using confirmation tools
Patterns alone aren’t enough. Indicators, trend lines, and volume are essential allies.
Tools and Software for Candlestick Pattern Recognition
Technology can speed up your pattern analysis and reduce errors.
TradingView
- Offers pre-built candlestick scanners
- Easy to set alerts for specific pattern formation
MetaTrader indicators
- Use plug-ins like Candle Pattern Indicator or Pattern Recognition Master
- Helps automate detection
AI-based pattern recognition
Advanced platforms now use machine learning to identify complex formations and flag high-probability setups in real time.
Real-Life Examples and Case Studies
Let’s see how candlestick patterns play out in actual trading situations.
Examples from recent market moves
- Tesla (TSLA) formed a Bullish Engulfing in 2023 before rallying 20%
- Bitcoin (BTC) flashed a Morning Star in early 2024 near $30,000 before rebounding to $40,000
What worked, what failed, and why
Success depended on:
- Context (support zone, trendline)
- Confirmation (volume and indicators)
- Avoiding entries during news events (which often invalidate technical setups)
FAQs about Candlestick Patterns
What’s the best candlestick pattern for beginners?
The Hammer and Bullish Engulfing are easy to spot and highly effective, especially on higher timeframes.
How many candles confirm a trend?
Typically, two or more strong candles in the same direction signal a trend, especially when breaking resistance or support.
Can patterns be trusted in crypto?
Yes, but due to high volatility, confirmation through volume and momentum indicators is even more important.
Is price action better than candlestick analysis?
Candlestick analysis is a part of price action. Used together, they provide a fuller picture of market sentiment.
Do patterns work in all markets?
Yes. Stocks, forex, commodities, and crypto—all respond well to candlestick patterns when used correctly.
What’s the most profitable candlestick strategy?
Combining Bullish/Bearish Engulfing with volume spikes near support/resistance zones on the 1-hour or daily chart often yields high-probability trades.
Conclusion and Final Thoughts
Candlestick patterns remain one of the most powerful tools in a trader’s arsenal. From simple single-candle formations to complex multi-candle structures, they reveal the hidden emotions of the market—fear, greed, and indecision. When used in context, confirmed with volume and technical indicators, and aligned with trend analysis, candlestick patterns can dramatically enhance your trading accuracy and confidence.
Whether you’re a day trader, swing trader, or long-term investor, mastering candlestick pattern recognition is a valuable skill that pays dividends over time.